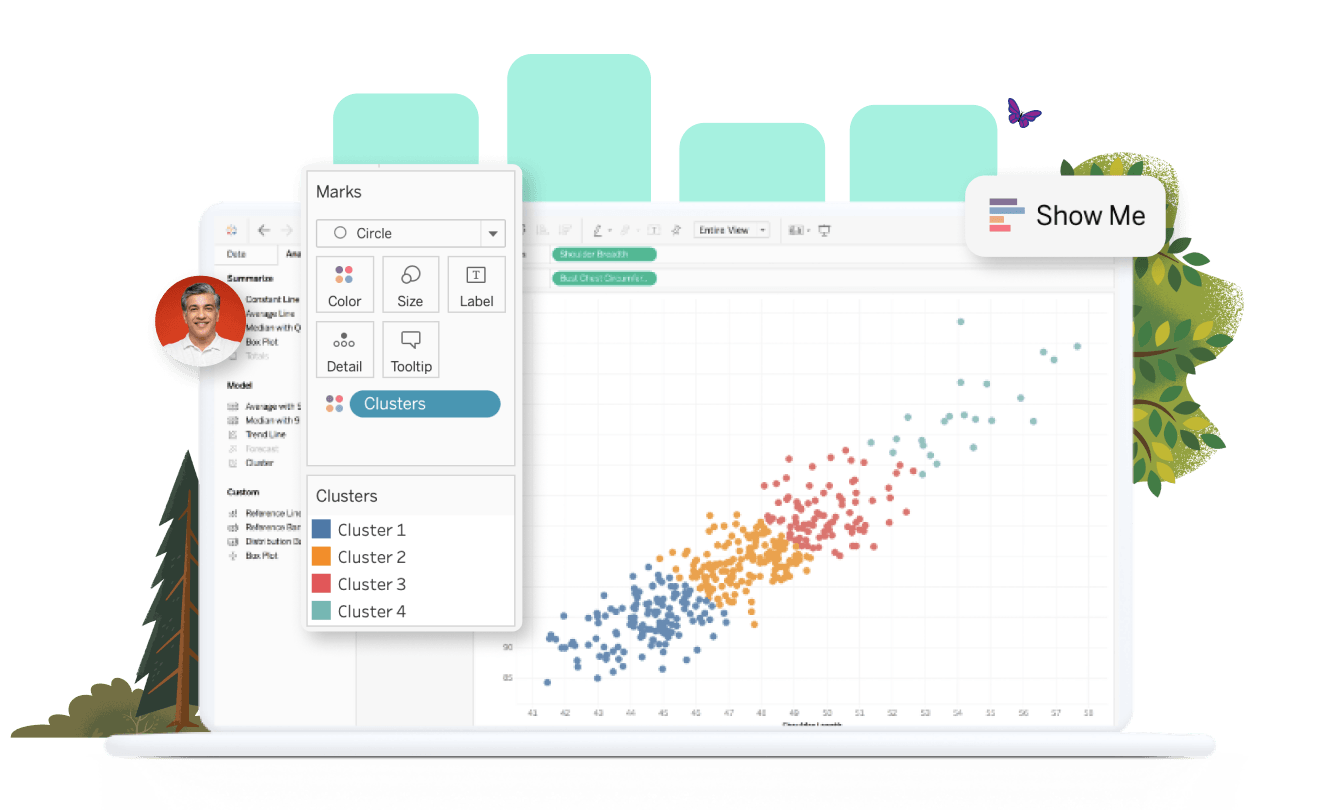
Corporations and organizations are increasingly relying on data to make better business decisions and students skilled in data analysis and visualization are better equipped to work in this data-driven environment. To help students develop these necessary skills, the Fox School of Business has launched a new BBA core course for undergraduate students: BA 2501: Turning Numbers into Knowledge: Visualizing Data.
Students spend the first five weeks of the semester in Tableau boot camp, learning the basics of Tableau, a powerful data visualization tool. Then, they spend the balance of the semester applying their Tableau knowledge to creating engaging, professional visuals using data. Students also have the chance to practice with familiar datasets from STAT 2103, creating continuity in the undergraduate curriculum. We are excited to see what compelling stories our students will tell using data.
Design and development of this new course demonstrated collaboration across Fox’s academic units and departments. A special thanks to Mart Doyle (Fox/MIS) and Lauren Kerner (Fox performance analytics) for their collaboration with faculty and the Fox ODL team.
